Corporate identity graphs in Python
Geplaatst op: december 8, 2020

Do you recognize feeling frustrated about the looks of the standard Python graphs? Or you just need your corporate identity to be reflected in these graphs to be able to directly use them in a presentation? Well, I feel you! This is exactly the problem I ran into when happily working within my Python scripts and notebooks.
So, when my colleague Wouter van Gils showed me the corporate identity template he created for R, I decided to follow his lead and do exactly that for Python as well.
Luckily, this is actually quite straightforward in Python. We can create our own style by using the elaborate example that can be found in the matplotlib documentation. In my case I chose to only add the elements that I wanted to change and save the file as cmotions.mplstyle.
For me, the content of the file looks like this:
font.family : verdana
font.size : 8.0
xtick.labelsize : 10
ytick.labelsize : 10
axes.grid : False
axes.linewidth: 0.0
axes.prop_cycle : cycler('color', ['003D7C', 'F5A507','7C3F00','000000' ,'FFDC51','ACACAC', '1F77B4', 'FF7F0E', '2CA02C', 'D62728', '9467BD' , '8C564B', 'E377C2', '7F7F7F', 'BCBD22', '17BECF'])
xtick.bottom : False
ytick.left : False
legend.edgecolor : 1.0
legend.framealpha : 1.0
legend.frameon : False
legend.title_fontsize : 0.0
lines.linewidth : 3
axes.labelcolor : white
axes.titlesize : 20
axes.titleweight : bold
figure.figsize : 12, 12
Only thing I need to do before creating graphs is to add the following two lines of code to my script or notebook:
import matplotlib.pyplot as plt
plt.style.use('path_to_file/cmotions.mplstyle')
After running these lines my corporate identity theme will not only be used by matplotlib, but also when creating graphs using seaborn and pandas.
In the next code example you can see how I use my corporate identity style in Python.
# import packages
import pandas as pd
import matplotlib.pyplot as plt
# import your corporate identity styling
# in this case the mplstyle file is in the same folder as this notebook
# if this is not the case (which is probably the case), simply add the filepath to the filename
plt.style.use('cmotions.mplstyle')
# create an example dataset
df = pd.DataFrame({'category': ['cat1', 'cat1', 'cat1', 'cat2', 'cat2', 'cat2', 'cat3', 'cat3', 'cat3',
'cat4', 'cat4', 'cat4', 'cat5', 'cat5', 'cat5', 'cat6', 'cat6', 'cat6'],
'year': ['2018', '2019', '2020', '2018', '2019', '2020', '2018', '2019', '2020',
'2018', '2019', '2020', '2018', '2019', '2020', '2018', '2019', '2020'],
'value': [2,5,6,4,7,10,5,8,12,2,4,6,4,6,8,8,8,12]}, columns=['category', 'year', 'value'])
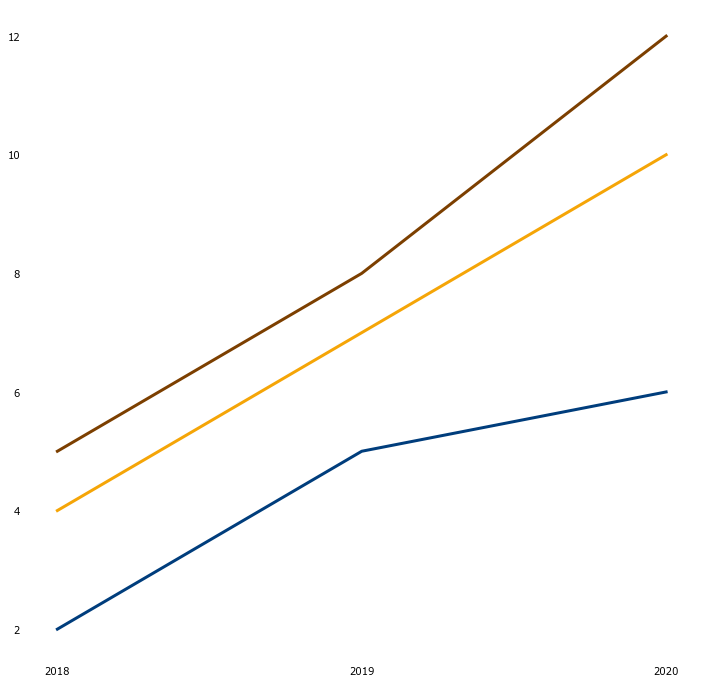
# line graph
plt.plot('year', 'value', data=df[df.category=='cat1'])
plt.plot('year', 'value', data=df[df.category=='cat2'])
plt.plot('year', 'value', data=df[df.category=='cat3'])
plt.show()
# bargraph
plt.bar('category', 'value', data=df)
plt.show()
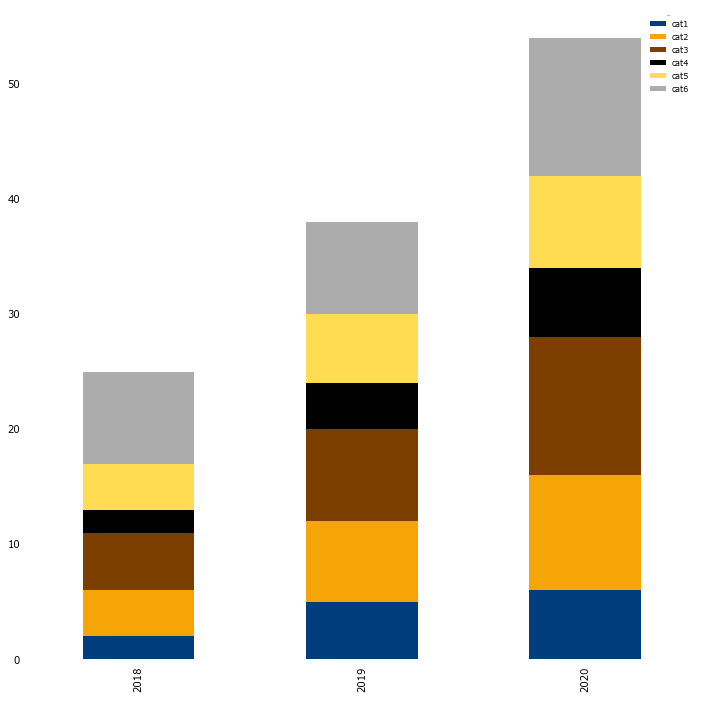
# before creating a stacked bar, we need to pivot our data
pivot_df = df.pivot(index='year', columns='category', values='value')
# stacked bargraph
pivot_df.plot.bar(stacked=True)

Of course more changes can be made, depending on your needs. I hope this basic example is useful to you when you want your corporate identity reflected in your Python output.
Enjoy creating your own corporate identity theme!


Corporate identity graphics in R
Geplaatst op: november 30, 2020

This blog is about getting corporate identity graphics ready in R using ggplot. Many corporates have decent identity Powerpoint decks and Excel templates available to work with, they might even have developed a PowerBI/Tableau template to fit their corporate identity. Yet, identity templates for R (or other languages used) are often not readily available. Marketing often does not have these tools in scope while developing templates to be used once a new corporate identity has been launched. The default graphics that ggplot provides in R are already of good quality. Sometimes the color palette needs some improvement and occasionally the axis need some editing before things look sharp. Wouldn’t it be great if all graphics you produce running an analysis were by default matching with the colors, fonts and layout of your brand?
If you work as an analyst or a consultant like me and create visuals for clients in R this post is useful for you. On more than a few times I’ve noticed that clients really appreciate it when presented visuals that match their corporate identity style. And here is the thing, my company – Cmotions – recently published a new corporate identity. A few weeks ago I was developing materials for some courses at our academy.
I created new content for those courses in R matching our new identity. I read a few examples and blogposts of analysts with a similar question. In this blog I share my experience with you, it turned out to be rather easy to create a ggplot template in R matching a corporate identity.
First thing you need to do is register the Windows fonts in R. By default the fonts in R to choose from are limited.
# Make sure all Windows fonts are available within R
library(extrafont)

# Auto detect all Windows TTFs. use fonts() or fonttable() for a complete overview afterwards
font_import()

# Register fonts for Windows bitmap output
loadfonts(device="win")
Next you need to create a color palette matching the corporate identity you want to be reflected in ggplot output.
# Cmotions default palette
palette_cmotions <- c("#003D7C","#F5A507","#7C3F00","#000000","#FFDC51","#ACACAC")
You have two options to go forward: first is to create a new ggplot template from scratch by specifying all elements. It will give you maximum control and also a lot of work. Second option is to use an existing theme and only edit those part as you see fit. I’m choosing the theme_bw that comes with ggplot and alter only those parts I think are necessary to match my corporate identity. As you can see in the code below I’ve added many element_blank() tags so my legend does not have a title, the panel does not have a border and by default the plot has no background.
# load ggplot
library(ggplot2)

# Create Cmotions theme for ggplot
theme_cmotions <- function() {
theme_bw(base_size=8, base_family="Verdana") %+replace% # use theme_bw as default, replace font family
theme(
# adjust legend
legend.background = element_blank(),
legend.title = element_blank(),
# adjust axis
axis.ticks = element_blank(),
axis.title.y = element_blank(),
axis.title.x = element_blank(),
axis.text = element_text(color = "black"),
# adjust panel;
panel.background = element_rect(colour = "white"),
panel.border = element_blank(),
panel.grid = element_blank(),
# adjust plot
plot.background = element_blank(),
plot.title = element_text(family="Arial Black", face="bold", colour="black", size=14),
complete = TRUE
)
}
Using the created template is easy, just specify which theme you want to use in the ggplot command. First let me set up some dummy data to use.
# create data for example plots

df <- data.frame(category = c('cat1', 'cat1', 'cat1', 'cat2', 'cat2', 'cat2', 'cat3', 'cat3', 'cat3', 'cat4', 'cat4', 'cat4', 'cat5', 'cat5', 'cat5', 'cat6', 'cat6', 'cat6'),

year = c('2018', '2019', '2020', '2018', '2019', '2020', '2018', '2019', '2020', '2018', '2019', '2020', '2018', '2019', '2020', '2018', '2019', '2020'),

value = as.numeric(c('2','5', '6', '4','7', '10', '5','8', '12', '2','4', '6', '4','6', '8', '8','8', '12')))
Next I create 4 different plots and specify the new theme I would like to use and the color palette.
# Example for bar chart - no legend
bar <-ggplot(df, aes(category, value, fill = category)) +
geom_col(show.legend = FALSE) +
theme_cmotions() +
ggtitle("Category example") +
scale_fill_manual(values = palette_cmotions)

# Example for stacked bar chart - only 3 categories
stacked<-ggplot(df[1:9,], aes(year, value, fill = category)) +
geom_col() +
theme_cmotions() +
ggtitle("Category stacked example") +
scale_fill_manual(values = palette_cmotions)

# Example for line chart
line<-ggplot(df[1:9,], aes(year, value, group = category, color=category)) +
geom_line(size=2) +
theme_cmotions() +
ggtitle("Category trend") +
scale_color_manual(values = palette_cmotions)

# Example for bar chart - facet
facet<-ggplot(df, aes(year, value, fill = category)) +
geom_bar(stat="identity") +
theme_cmotions() +
ggtitle("Category example - facet") +
facet_wrap(~ category, nrow=2, ncol=3) +
scale_fill_manual(values = palette_cmotions) +
theme(strip.background = element_blank(), strip.text.x = element_blank()) # without the strip

# Display examples
library(gridExtra)
grid.arrange(bar,stacked,line,facet, ncol=2)

If you want to use this new theme as a default theme just add the lines below to your .Rprofile and the theme will be set during R startup.
# code to add to .Rprofile for Cmotions theme as default
setHook(packageEvent("ggplot2", "onLoad"),
function(...) ggplot2::theme_set(ggplot2::theme_cmotions()))
Of course more changes can be made, depending on your needs. I hope this basic example is useful to you when you want your corporate identity reflected in your R output.

Natural Language Processing for predictive purposes with R
Geplaatst op: november 13, 2020

How to uncover the predictive potential of textual data using topic modeling, word embedding, transfer learning and transformer models with R
Textual data is everywhere: reviews, customer questions, log files, books, transcripts, news articles, files, interview reports … Yet, texts are still (too) little involved in answering analysis questions, in addition to available structured data. In our opinion, this means that some of the possible predictive power is not used and an important part of an explanation is missed. Why is that the case? Textual data, in contrast to structured data from databases and tables, is not ready for usage in analyzes, data visualizations and AI models. It takes some extra effort, texts must be correctly converted into numerical representations, so that the tools and techniques that analysts and data scientists use to answer the business questions can work with them.
Despite the rise in popularity of Python, R is still used by many crafted analysts and data scientists to analyze, visualize and build predictive models. But whereas there are many blogs, books and tutorials on how to use NLP techniques with Python, the availability of examples is much more limited for R users. Also, not that many blogs compare techniques on the same data and show how to prepare the textual data and what choices to make along the way to answer a business question. In our series of blogs, 6 in total, we are closing some gaps and show how to get value out of textual data using R. We show how to use different NLP techniques on exactly the same dataset, such as topic modeling, word embeddings and transformer models like BERT for a specific downstream task: predictive modeling. We show how to translate textual data into features for your model, preferably in combination with other, numeric features you have available for your predictive model to get most out of the data you have available.
Setting the scene: Restaurant reviews
Our articles center around restaurant reviews we have collected in our attempt to predict new Michelin stars. Late 2019 we attempted to predict the next Dutch Michelin star restaurants. Not an easy task, but by looking at restaurant reviews and especially the review texts, we got very nice results. For this prediction we used topic modeling and sentiment analysis to arrive at the best possible prediction of Michelin restaurants. In this series of articles, we show how we did that and expand to other more novel NLP techniques. Links to all articles in this series can be found below, all notebooks (originally written in Azure Databricks) can be downloaded from our gitlab page, links to the available data sources can be found within the notebook code.
Data preparation
Anyone who has worked with textual data will confirm that preparing text before you can analyze it is quite different compared to preparing numeric, structured data. Therefore, we’ve written a separate blog to show you how we preprocess our textual data before we use it for our NLP tasks. Key is that choices you need to make during preprocessing — such as what words to exclude, what to do with quotes, interpunctions, plurals, capitals, … — potentially have a major impact on analysis results. While preprocessing text, a lot of choices are to be made. It’s quite a challenge to find the right balance between rethinking all earlier choices you’ve made on the one hand while not rushing through and making suboptimal or even harmful choices on the other hand.
The best advice we can give to you, is to take at least a moment — a few seconds, a minute or two, sometimes an hour if needed — to give each of those choices a thought, annotate choices explicitly in your code and in case you are really in doubt what to do (and only then!) make this choice a parameter you can iterate and evaluate to find out what the best option is. Be very careful not to make too many parameters though! There are simply too many choices to make and before you know it, you are iterating for hours or even days because you didn’t have the nerve to follow your guts (which is most often the best you can do). But even worse than that is skipping all choices and use an out-of-the-box text preprocessor that makes all choices for you, resulting in preprocessed text for which you have no clue what harm is done to the actual texts. Aside from that, the knowledge and familiarity with the texts you build by preprocessing it yourself will definitely pay off when analyzing your texts.
Topic modelling
Building a good topic model requires a mix of expertise, creativity and some perseverance. Nevertheless, it is a great text analytics tool to have at your disposal. As a data scientist you are at the steering wheel when extracting topics from text. Topic modeling is the collective name for techniques that help to divide texts into topics, whereby determining the relevant topics is part of the analysis. As this is an unsupervised technique it requires many iterations, creativity and an eye for interpretability of the end result. A good working relation with your (internal) client is also of utmost importance here, discussing draft results and getting feedback on the topics extracted is key for success. Anyone can extract topics, but the goal is to extract topics that discriminate, are appealing and of value in the downstream task. Yes, other, more novel NLP techniques might beat topic models in terms of accuracy. However, a big upside in using the topics extracted from the text in a downstream task is that the contribution of each topic (and other features you have available) in the prediction model is easily analyzed and visualized. This is not only useful for you but foremost to anyone you are explaining the predictive model to.
Word embedding
Although our first topic model results were great, we did lose a lot of information in our texts, translating the full reviews into less than 10 features — the topic probabilities. To reveal much more subtleties hidden in the review texts, we use word embeddings to improve our predictions. Word embeddings are a representation of text where words that have the same meaning have a similar numeric representation. Have you ever heard the example: King — Man + Woman = Queen? This is word embeddings in action. This technique captures the semantic similarities between words, and these similarities (of distances) can be useful for prediction purposes. The upside of using word embeddings in that you can visualize them quite easily. A visual representation of word similarities for humans is much better to grasp than a matrix with numbers. Also, training word embeddings on your own documents provides tailor made input for your downstream task. The word similarities are used in a Neural Network for prediction purposes. Yes, as we show in our blog, having both the word similarities as well as the review features in a single prediction model can be a bit daunting and choosing the correct neural network architecture and model configuration can take some time as well. But looking back, model performance was overwhelmingly good.
Transformer models and BERT
How can we discuss getting value of textual data and not talk about transformer models and BERT? We can’t! In our last blog we show you how you can stand on the shoulders of giants by using pretrained NLP models you can use for your downstream task in R. We show how to do that with and without finetuning the pretrained model and show the difference in performance. Using Transformer models and in particularly the models trained for the Dutch language (BERTje and RobBERT) provided a significant uplift in model performance of our downstream prediction task. However, this improved fit comes at a price. First, using these models requires cloud computing capabilities or enough GPU resources. So, it is good to ask yourself upfront: how accurate do my predictions need to be? In general, the ready-to-use BERT models are trained on large amounts of general text (Wikipedia, Google books and web-crawl), so it may not always be the best way to go if you have text from a niche environment (in our case restaurant reviews). Second, the interpretation of these deep neural network models makes it hard to explain and interpret exactly how the textual data help in your downstream task. When interpretability is important for the problem you are trying to solve, the improved accuracy might not outweigh this decrease in interpretability in comparison to other techniques.
Closing remarks
If you find yourself in a position where extracting value from text is needed to improve downstream task performance, we hope this NLP with R series has inspired you and helps you to get started. Which technique is most suitable for you is something to find out for yourself. Some general advise from our side: if interpretability of the predictive model is important then topic modeling is the best way to go. If your predictions need to be very accurate and you cannot afford many false positives then a Transformer model like BERT might be the best choice. They provide top-notch accuracy but also require much computing time and resources. When you are looking for decent model performance and are willing to scale down a bit on interpretability then word embeddings are an elegant option. Training the embeddings on your own text is quite easy and visualizing word differences will stimulate your imagination. Links to all articles in our NLP with R series written by Jurriaan Nagelkerke and Wouter van Gils can be found below:
- NLP with R part 0: Data preparation for NLP: the right recipe for success
- NLP with R part 1: Identifying topics in restaurant reviews with topic modeling
- NLP with R part 2: Training word embedding models and visualizing the result
- NLP with R part 3: Predicting the next Michelin stars with topic modeling
- NLP with R part 4: Use of word embedding and transfer learning in prediction models
- NLP with R part 5: Using state-of-the-art NLP technology with Transformers & BERT
We hope to inspire you with these articles and get you started with monetizing textual data in R yourself. We think it is important that anyone can use these articles as a starting point. That is why the notebooks and data we use are available on our gitlab page. We would love to hear your feedback and experience!

Get (even more) inspired in our NLP workshop where you learn everything you need to get started quickly
State of the Art in NLP: Transformers & BERT
Geplaatst op: oktober 28, 2020

Check out all our blogs in this NLP series. Notebooks and dataset are freely available from out gitlab page:
- Before we start: Preparation of review texts for NLP
- Topic Modeling to identify topics discussed in the restaurant reviews
- Training Word Embedding models and visualize results
- Using Topic Modeling Results to predict Michelin Stars
- Using Word Embedding models for prediction purposes
- State of the Art in NLP: Transformers & BERT (BERTje/RobBERT/DistilBERT)
NLP: Using Word Embedding Models for Prediction Purposes
Geplaatst op: oktober 14, 2020

Check out all our blogs in this NLP series. Notebooks and dataset are freely available from out gitlab page:
- Before we start: Preparation of review texts for NLP
- Topic Modeling to identify topics discussed in the restaurant reviews
- Training Word Embedding models and visualize results
- Using Topic Modeling Results to predict Michelin Stars
- Using Word Embedding models for prediction purposes
- State of the Art in NLP: Transformers & BERT (BERTje/RobBERT/DistilBERT)
NLP: Use Topic Modeling Results in Predictive Modeling
Geplaatst op: september 30, 2020

Check out all our blogs in this NLP series. Notebooks and dataset are freely available from out gitlab page:
- Before we start: Preparation of review texts for NLP
- Topic Modeling to identify topics discussed in the restaurant reviews
- Training Word Embedding models and visualize results
- Using Topic Modeling Results to predict Michelin Stars
- Using Word Embedding models for prediction purposes
- State of the Art in NLP: Transformers & BERT (BERTje/RobBERT/DistilBERT)
Copy or use data from two Azure databases – create external data source
Geplaatst op: september 25, 2020

Ever since we started to develop our Data Science off the Shelf (DOTS) products at Cmotions our usage of Azure SQL databases has increased significantly. Since we value the privacy of our customers, and of the customers of our customers, we strongly believe in privacy-by-design. For us, this also means we end up with quite a few different databases, which sometimes partly need the same information (of course without violating any privacy decisions we’ve made). Being used to working with an on-premise SQL server, we approached this problem as we would normally do: simply use two databases in the same query. Little did we know! Each Azure database might be on the same Azure server from our point of view, but since this is a virtual server, Azure does not view them as being on the same server. We also tried to use the other well-known solution: linked servers, but also without any success. But luckily for us there is an easy solution for this problem; we can reference a database from another database and use the necessary tables anyway.
We start by opening our SQL Server Management Studio and connecting to the database we want to copy/use data from another database in (our target database). All code below will be executed in this target database. If we talk about a source database, we mean the database where the data lives which we want to copy or use in our target database.
In the script below we assume you want to copy data from one database to another, but you could of course also keep the connection and reference table(s) and use them like that in your queries from now on. This could be especially useful if you have some dataset that you need in multiple databases and that changes regularly.
-- TARGET DATABASE: DATABASE YOU ARE CURRENTLY CONNECTED TO
-- SOURCE DATABASE: DATABASE YOU WANT TO CONNECT TO FROM YOUR TARGET DATABASE

------------------------
-- CREATE CREDENTIALS --
------------------------
-- one time only: create a master key and supply the necessary credentials to access the source database
CREATE MASTER KEY ENCRYPTION BY PASSWORD = 'justsomerandompasswordweonlyneedinthisscript';

CREATE DATABASE SCOPED CREDENTIAL cred
WITH IDENTITY = 'the username to access the source database',
SECRET = 'the password belonging to the username to access the source database';

---------------------------------
-- CREATE EXTERNAL DATA SOURCE --
---------------------------------
-- once for every different source database you want to access
CREATE EXTERNAL DATA SOURCE name_of_source_database
WITH
(
TYPE=RDBMS,
LOCATION='servername.database.windows.net',
DATABASE_NAME='databasename',
CREDENTIAL= cred
);

---------------------------
-- CREATE EXTERNAL TABLE --
---------------------------
-- now we can access the source database
-- in order to do this we create a reference table in our target database
-- this table directly references to the table/view from the source database
-- this external table is a read-only table
-- the column specifications need to exactly match that of the original table in the source database
CREATE EXTERNAL TABLE [dbo].[name_of_temporary_external_reference_table](
[COL1] [varchar](255) NULL,
[COL2] int NOT NULL,
-- ...
)
WITH
(
DATA_SOURCE = name_of_source_database,
SCHEMA_NAME = 'dbo',
OBJECT_NAME = 'name_of_object_you_want_to_reference_to'
)
-----------
-- QUERY --
-----------
-- now we can copy the data we want to our own database
SELECT   *
INTO  name_of_new_table_in_target_database
FROM  name_of_temporary_external_reference_table

--------------
-- CLEAN-UP --
--------------
-- after all data is copied we want to remove everything we created to keep our database clean
-- drop the external table
DROP EXTERNAL TABLE name_of_temporary_external_reference_table
-- drop the reference to the other database
DROP EXTERNAL DATA SOURCE name_of_source_database
-- drop the credentials
DROP DATABASE SCOPED CREDENTIAL cred
-- drop the master key
DROP MASTER KEY
NLP: Word Embedding
Geplaatst op: september 16, 2020

Check out all our blogs in this NLP series. Notebooks and dataset are freely available from out gitlab page:
- Before we start: Preparation of review texts for NLP
- Topic Modeling to identify topics discussed in the restaurant reviews
- Training Word Embedding models and visualize results
- Using Topic Modeling Results to predict Michelin Stars
- Using Word Embedding models for prediction purposes
- State of the Art in NLP: Transformers & BERT (BERTje/RobBERT/DistilBERT)
NLP: Topic Modeling
Geplaatst op: september 1, 2020

Check out all our blogs in this NLP series. Notebooks and dataset are freely available from out gitlab page:
- Before we start: Preparation of review texts for NLP
- Topic Modeling to identify topics discussed in the restaurant reviews
- Training Word Embedding models and visualize results
- Using Topic Modeling Results to predict Michelin Stars
- Using Word Embedding models for prediction purposes
- State of the Art in NLP: Transformers & BERT (BERTje/RobBERT/DistilBERT)