How to fix 7 data issues
In a previous blog our data scientist Meta used XGBoost to build a well performing model in a fast way. However: building superfast or complex high perfoming blackbox models is not always an option. Which methods you choose depends on the business goal, (legal) restrictions, available time, and your personal preference…
Different perspectives of our data science heroes:
- Andy: 'Good-old regression gives you more insight and control on how the model is put together. Therefore it can be explained to the business. This is why I prefer regression above blackbox models like XGBoost.'
- Meta: 'Regression? That comes with a lot of data preparation and testing what is best. Where do I find the time for that? Just using my xgboost standard notebook script is much faster'
- Aki: 'I don't prefer a specific model. I evaluate different models and choose the best one for the specific challenge.'
- Eqaan: 'Personaly I like to be able to explain my model to the business, but not when this decreases the model performance drastically. Also modelling may take time, but I do not have that much time...The art is striking the right balance'
What is the problem with dirty data?

Data scientists spend 80% of their time preparing data
One of the biggest challenges for data scientists is how to deal with 'bad' data. Preparing data for predictive modelling can be very difficult and costs a lot of time.
First you access, combine and preprocess data to build an analysis dataset. Secondly you modify this dataset to make it fit for your model.

Garbage in = Garbage out
Normally there are some serious challenges preparing your data. How much you have to 'repair' also depends on what type of model you use. One of the most demanding is a regression model. It can have problems with input variables with: missing values, overlapping information, huge outliers, ZIP codes or some other variable with too many levels and more. On the other hand, regression models are very powerful if you want to understand what is happening and results are ofter very stable over time. And even when you won't use regression, a deeper understanding of your data will always help you in building better models.
If you use regression, you have to deal with the data...
How to fix 7 common data issues
There is a wide variety of data problems you can encounter when building a regression model. Each data issue has different ways to solve it. More detail follows in next blogs.
Hereby an overview of common data issues and methods:
Missing data
You cannot do calculations with missing values. Formula-based algorithms like regression or neural networks cannot handle records with missing values. Throwing these records away often is not and option: The fact that the value is missing might represent information you could benefit from! Creating flag variables to indicate missings and replace the missing values are a way 'repairing' your data. Most used method is to impute (= replace) missing values by the mean or median. However, sometimes this results in lower performance than replacing it with a constant value. It might mean 0! More advanced options like predicting missings are also available. Read more on this topic in our blog on missing data.
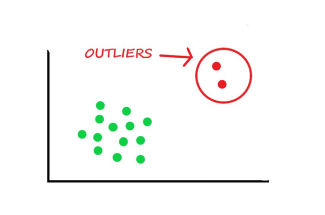
Outliers

Often variables are skewed. Most values are low, some high, few very high. Algorithms like regression or neural networks can get into problems. It is common to transform variables (normalize, log), bin to intervals or truncate high values. Also, outliers might indicate errors in the data. A customer of age 412? That requires other ways to deal with.
Too many levels
Categorical features with many levels can have a lot of rare levels. This is called ‘high cardinality’. They do not have sufficient datapoints for calculations. Algorithms like regression or neural networks will become unstable or unreliable. You can combine rare levels to ‘other’ and then use One Hot Encoding (=dummies). For example: IsPurple with 1 = yes and 0 = no. There are other more advanced ways, like smooth weight of evidence or optimal binning. But: do these advanced methods improve your model? Read more on this topic in our blog on high cardinality.
Irrelevant variables
Worst case your data may have hundreds of variables. It will become difficult, and time consuming to explore and model relationships between variables. This is called the curse of dimensionality. Reducing dimensionality will reduce complexity.
One way to deal with it is to throw away variables that have hardly any relationship with the target. You can use several measures like the Pearson correlation coefficient to eradicate irrelevancy. Or you can use techniques to combine features into new features, keeping most relevant information on board.
Overlap in information
Another way to reduce high dimensionality is to remove redundant variables. Resulting problems are instable parameter estimates, an overfitted model and difficulty to interpret the model. You could use correlation analysis, Principal Component Analysis, or measures like Variance Inflation Factor.
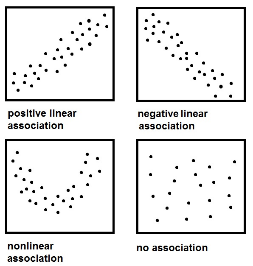
Non-linearities

Non-linear relationships are a problem for (log) linear models like (logistic) regression. Exploratory data analysis is a great way to get to know the relationships in your data. You can explore by looking at several correlation measures like Pearson, Spearman or Hoeffding. Or gain more insight with graphs like a scatterplot or an empirical logit plot. Then you can choose which transformation works best. For example: optimal binning, log-transformation or normalize data.
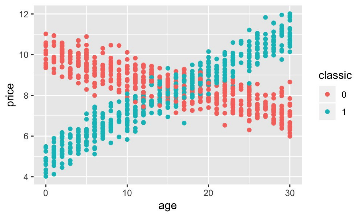
Interactions

An interaction occurs when the relationship of a variable and a target differ depending on the values of another variable. Like the price of a car gets lower when the car is older, but not for classic cars. Not all algorithms automatically take interactions into account, which might lead in underperforming models. An ICE plot (Individual Conditional Expectation) visualizes interactions. Or use decision trees to find strong interactions. You can put these interactions in your model.
How will you handle your data prep?
In short. Most data are not fit right away for regression. Each data issue has several ways to fix it. What solution is best strongly depends on the context. Next blogs we'll discuss how our data scientists handle some of these issues, starting with high cardinality.
We are curious to hear your opinion and suggestions. All remarks are welcome!